
Solar generation
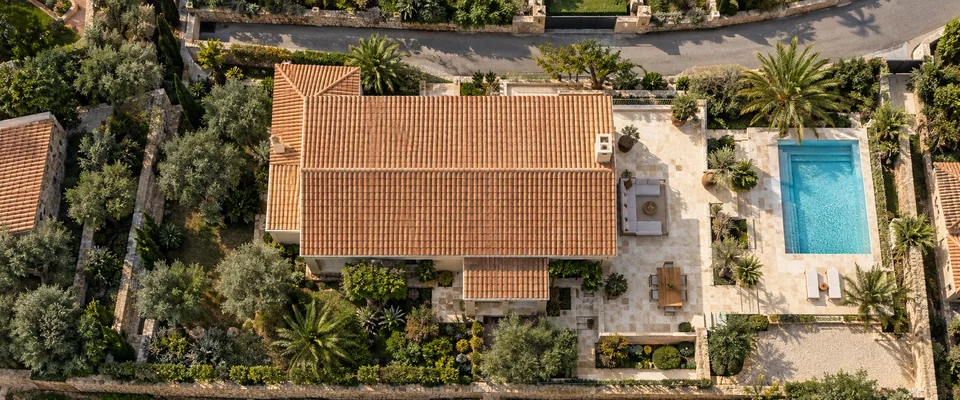
Discover your roof’s potential
10 new panels × 500 W
- System capacity
- 5 kWp
- Example annual generation
- ≈ 8 055 kWh
Illustrative scenario. Not a calculation for this house.
Google could not show this point. Check the coordinates before continuing.
2. Roof image
In Spain, confirm the building on the IGN/PNOA image and trace one roof face. Elsewhere, continue by point and panel count.
Generation is calculated for your selected point where PVGIS data is available. Roof-image coverage is separate.
Drag the image with your mouse or one finger. Use two fingers or +/− to zoom. “Center roof” returns to the roof. Scroll outside the image to move down the page.
Tools
Mark the corners of one roof face. Exclude chimneys and skylights. Keyboard: arrows and Enter.
Drag the selected group. Pull the round ↻ handle above it to rotate. Red marks panels outside the roof, near obstacles or overlapping. Rotation changes layout within the roof plane, not the roof’s solar facing.
Editing help
Panel surfaces only, excluding gaps and edge clearances.
This prototype does not detect roofs automatically. A person confirms the outline and tilt.
Sources and scope
Google · Privacy · Google Maps · Terms
PVGIS 5.3 · ventilated mounting · 14% system losses plus your shading input. Climate average, not a guarantee. A service failure is never replaced with a nearby-city estimate.
Coverage screen derived from IGN Administrative Units (retrieved 2026-10-07). IGN · CC BY 4.0
Tensite EM500-BK-PH · 500W TOPCon N-Type Full Black · 1.134 × 1.909 m
Simple calculation by region
one360 · ENERGY, CLIMATE & SMART HOME
How much energy could your roof produce?
Monthly and annual estimates using official PVGIS data. Choose the nearest reference location and panel capacity.
PVGIS SARAH3 data · 2005–2023. Each reference represents one location, not the entire province.
Selected tilt and 14% system losses. Shading is additional. This is not a production guarantee.
PVGIS · European Commission